
What really drives private equity returns?
Build value creation models – at scale – with the ValueBridge App
A modern web application that brings rigorous private equity value creation mathematics to real-world portfolio sizes.
Accurately measure how leverage, operational improvements, and market forces impact portfolio company income statements, valuations, and capital structures.
Instantly aggregate returns and private equity value drivers by deal, fund, manager, and limited partner investment portfolio.
POWERFUL FEATURES THAT CANNOT BE REPLICATED IN EXCEL
We love Excel, but it does not scale for advanced value creation models with custom market benchmarks. The ValueBridge App stores data in the cloud and runs all calculations server-side, delivering instant results across portfolios with dozens or hundreds of companies.
Start using the ValueBridge App today!VALUE CREATION DASHBOARDS
Portfolio company value creation models instantly roll-up to fund, manager, and limited partner investment portfolio dashboards.
Absolute ($)
Times Money
Relative (%)
Value Creation IRR
Full control over each portfolio company's financial, operational, and market metrics. All returns are normalized for leverage and estimate the market's influence on growth, valuation, and capital structure to generate meaningful market vs. manager performance.
WHO IT'S BUILT FOR
Private equity practitioners who require robust and reliable value creation models at scale.
GENERAL PARTNERS
Deal teams and portfolio analysts who need to understand and illustrate how investment and value creation strategies drive returns.
LIMITED PARTNERS
Investment teams and consultants who want validate performance and value creation claims against standardized market datasets.
INDUSTRY RESEARCHERS
Academic and industry advisors working with larger datasets who need consistent and reproducible attribution models.
WHAT MAKES THE VALUEBRIDGE APP DIFFERENT?
Most recent private equity tools emphasize AI automation or broad data aggregation. The ValueBridge App takes a different approach: accurate, scalable, analyst-controlled attribution based on rigorous and publicly documented mathematics. It is a secure, server-side platform that simplifies data management and delivers instant calculations and aggregations — even across large portfolios.
MINIMAL INPUTS > MAXIMUM INSIGHTS
Powerful return and value creation insights that require minimal data entry:
Only 4-6 capital structure and P&L inputs per portfolio company transaction.
Runs on numbers typically found in fund reporting and marketing materials.
Designed for real PE deals with multiple inflows and outflows – follow-on equity and debt financings, add-on acquisitions, dividend recapitalizations, etc.
Easy quarterly maintenance – only upldate FMV changes and new investments or distributions; historical metrics remain locked.
MARKET VS. MANAGER DECOMPOSITION
Upload custom market datasets that automatically benchmark portfolio company performance against broader market trends:
Define addressable market sizes, EBITDA multiples, revenue multiples, and debt levels for typical sector peers.
Apply the same market metrics to hundreds of deals for consistent attribution.
Fine-tune market metrics to specific sectors and niches to isolate true manager-driven returns.
Superior to PME approaches due to flexibility and leverage normalization at the portfolio company level.
PROPER LEVERAGE NORMALIZATION
Automatically account for what many private equity value creation models fail to get right – the impact of portfolio company leverage on returns:
Debt’s amplification of equity gains and losses in LBOs.
Growth equity’s dampening of equity gains and losses.
Cash generated to pay down debt or consumed to fund growth initiatives during the holding period.
Enables meaningful value creation comparisons, even when portfolio companies have drastically different balance sheets.
INSTANT VALUE BRIDGES IN ANY FORMAT
Changes to portfolio company and market metrics instantly flow to fund, manager, and limited partner investment portfolio dashboards:
Absolute ($) value bridges explain the difference between invested and realized equity.
Times money illustrates value drivers scaled to total invested capital.
Relative (%) value creation shows value driver contributions to total equity gains.
Value creation IRRs provide relative, annualized measurements that account for time and capital required to generate each driver’s return.
NET MOIC AND NET IRR ESTIMATES
Allocate fund fees, expenses, and carry to portfolio companies to estimate net returns across any dimension (sector, geography, strategy, etc.):
Input actual management fees and expenses or estimate by fund size, fee rates, and portfolio company transaction dates.
Automatically estimate preferred return hurdle and GP catch-up from portfolio company investments and distributions.
Carried interest estimates instantly adjusted for any changes in investments, distributions, fair values, and transaction dates.
SECURE MULTI-TENANT ENVIRONMENT
Role-based access control powered by Supabase authentication and row-level security policies. Control access privileges to maintain data quality:
Admins: Invite users, create and manage workspaces, control overall tenant settings.
Full users: Full create, update, and delete permissions on permitted records.
Limited users: Create and update permissions with restricted delete capability.
Dashboard viewers: Read-only access to all results, charts, and aggregations; no editing rights.
TRANSPARENT, DOCUMENTED METHODOLOGIES
The ValueBridge App is not a black box. All inputs and outputs are exportable, and results can be independently verified with documented mathematics and models. Resources below include step-by-step instructions, videos, and Microsoft Excel templates, many of which are available for free. These are the same methodologies used by the ValueBridge App to analyze portfolios with dozens or hundreds of companies.
Launched in 2019

AUXILIA MATHEMATICA
Free private equity math website with over 600 users on six continents, including investment professionals at leading private equity firms and institutional asset managers.
Published in 2021
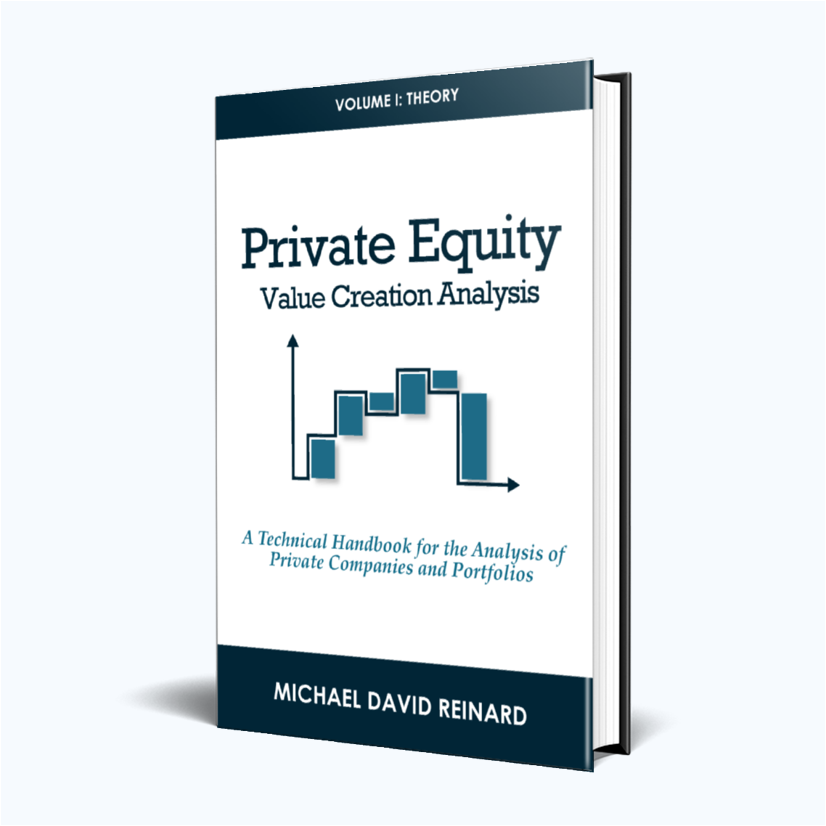
PRIVATE EQUITY VALUE CREATION ANALYSIS
Private equity math book that has sold 1,000 copies worldwide and consistently ranks in “Top-100 Private Equity” books on Amazon.com.
Launched in 2022

YOUTUBE CHANNEL
AUXILIA Mathematica’s YouTube channel hosts 100+ private equity-focused videos and has over 1,400 subscribers, 55,000 views, and 2,000 hours of watch time.
Launched in 2023

VALUEBRIDGE.NET
Subsription website hosting 80+ Excel templates with video demos, step-by-step instructions, online error checking tools, and live support to help analysts build private equity models even faster.
Subscribers receive full access to a library of 80+ Excel templates that are pre-built for various private equity scenarios. Use them to replicate results or create backups for marketing or compliance purposes. Models come with concise video instruction, step-by-step examples, and error-checking tools.
© 2026 ValueBridge, LLC